Current Connectivity Status
The Planning Team devised three Key Ecological Attributes (KEAs) and associated indicators to assess the current connectivity status of the watershed – Accessible Off-channel Thermal Refuge, Accessible Spawning Habitat, and Accessible Rearing Habitat. KEAs are the key aspects of anadromous salmonid ecology that are being targeted by this WCRP. The connectivity status for the Anadromous Salmonids KEAs were used to establish goals to improve habitat connectivity in the watershed and will be the baseline against which progress is tracked over time.
To support a flexible prioritization framework to identify priority barriers in the watershed, two assumptions are made: 1) any modelled (i.e., passability status is unknown) or partial barriers are treated as complete barriers to passage and 2) the habitat modelling is binary, it does not assign any habitat quality values. As such, the current connectivity status is refined over time as more data on habitat and barriers are collected.
```{r tbl5a, echo = FALSE, results = ‘asis’} #| label: tbl5a #| tbl-cap: “Table 5. Connectivity status assessment for thermal refuge (a), spawning (b), and rearing (c) habitat in the Lower Nicola River watershed. The Accessible Spawning Habitat and Accessible Rearing Habitat KEAs are evaluated by dividing the length of linear habitat (of each type) that is currently accessible to target species by the total length of all linear habitat (of each type) in the watershed.
a” #| warning: false #| echo: false source(“Rscripts/table_formatting.R”) library(“flextable”)
data <- read.csv(“data/table5a.csv”, check.names=FALSE) ft <- flextable(data) ft <- bg(ft, j = “Poor”, bg = “#ff0000”, part = “body”) ft <- bg(ft, j = “Fair”, bg = “#ffff00”, part = “body”) ft <- bg(ft, j = “Good”, bg = “#92d050”, part = “body”) ft <- bg(ft, j = “Very Good”, bg = “#008000”, part = “body”) ft <- format_flextable(ft) ft
Comments: A priority strategy is to develop an off-channel habitat layer for the watershed to be used to inform connectivity status in the future.


```{r tbl5b, echo = FALSE, results = 'asis'}
#| label: tbl5b
#| tbl-cap: "b"
#| warning: false
#| echo: false
source("Rscripts/table_formatting.R")
library("flextable")

data <- read.csv("data/table5b.csv", check.names=FALSE)
ft <- flextable(data)
ft <- bg(ft, j = "Poor", bg = "#ff0000", part = "body")
ft <- bg(ft, j = "Fair", bg = "#ffff00", part = "body")
ft <- bg(ft, j = "Good", bg = "#92d050", part = "body")
ft <- bg(ft, j = "Very Good", bg = "#008000", part = "body")
ft <- format_flextable(ft)
ft
Comments: Indicator rating definitions are based on the consensus decisions of the Planning Team. The current status is based on the WCRP model output, which is current as of May 2026.
```{r tbl5c, echo = FALSE, results = ‘asis’} #| label: tbl5c #| tbl-cap: “c” #| warning: false #| echo: false source(“Rscripts/table_formatting.R”) library(“flextable”)
data <- read.csv(“data/table5c.csv”, check.names=FALSE) ft <- flextable(data) ft <- bg(ft, j = “Poor”, bg = “#ff0000”, part = “body”) ft <- bg(ft, j = “Fair”, bg = “#ffff00”, part = “body”) ft <- bg(ft, j = “Good”, bg = “#92d050”, part = “body”) ft <- bg(ft, j = “Very Good”, bg = “#008000”, part = “body”) ft <- format_flextable(ft) ft
Comments: Indicator rating definitions are based on the consensus decisions of the Planning Team. The current status is based on the WCRP model output, which is current as of May 2026.
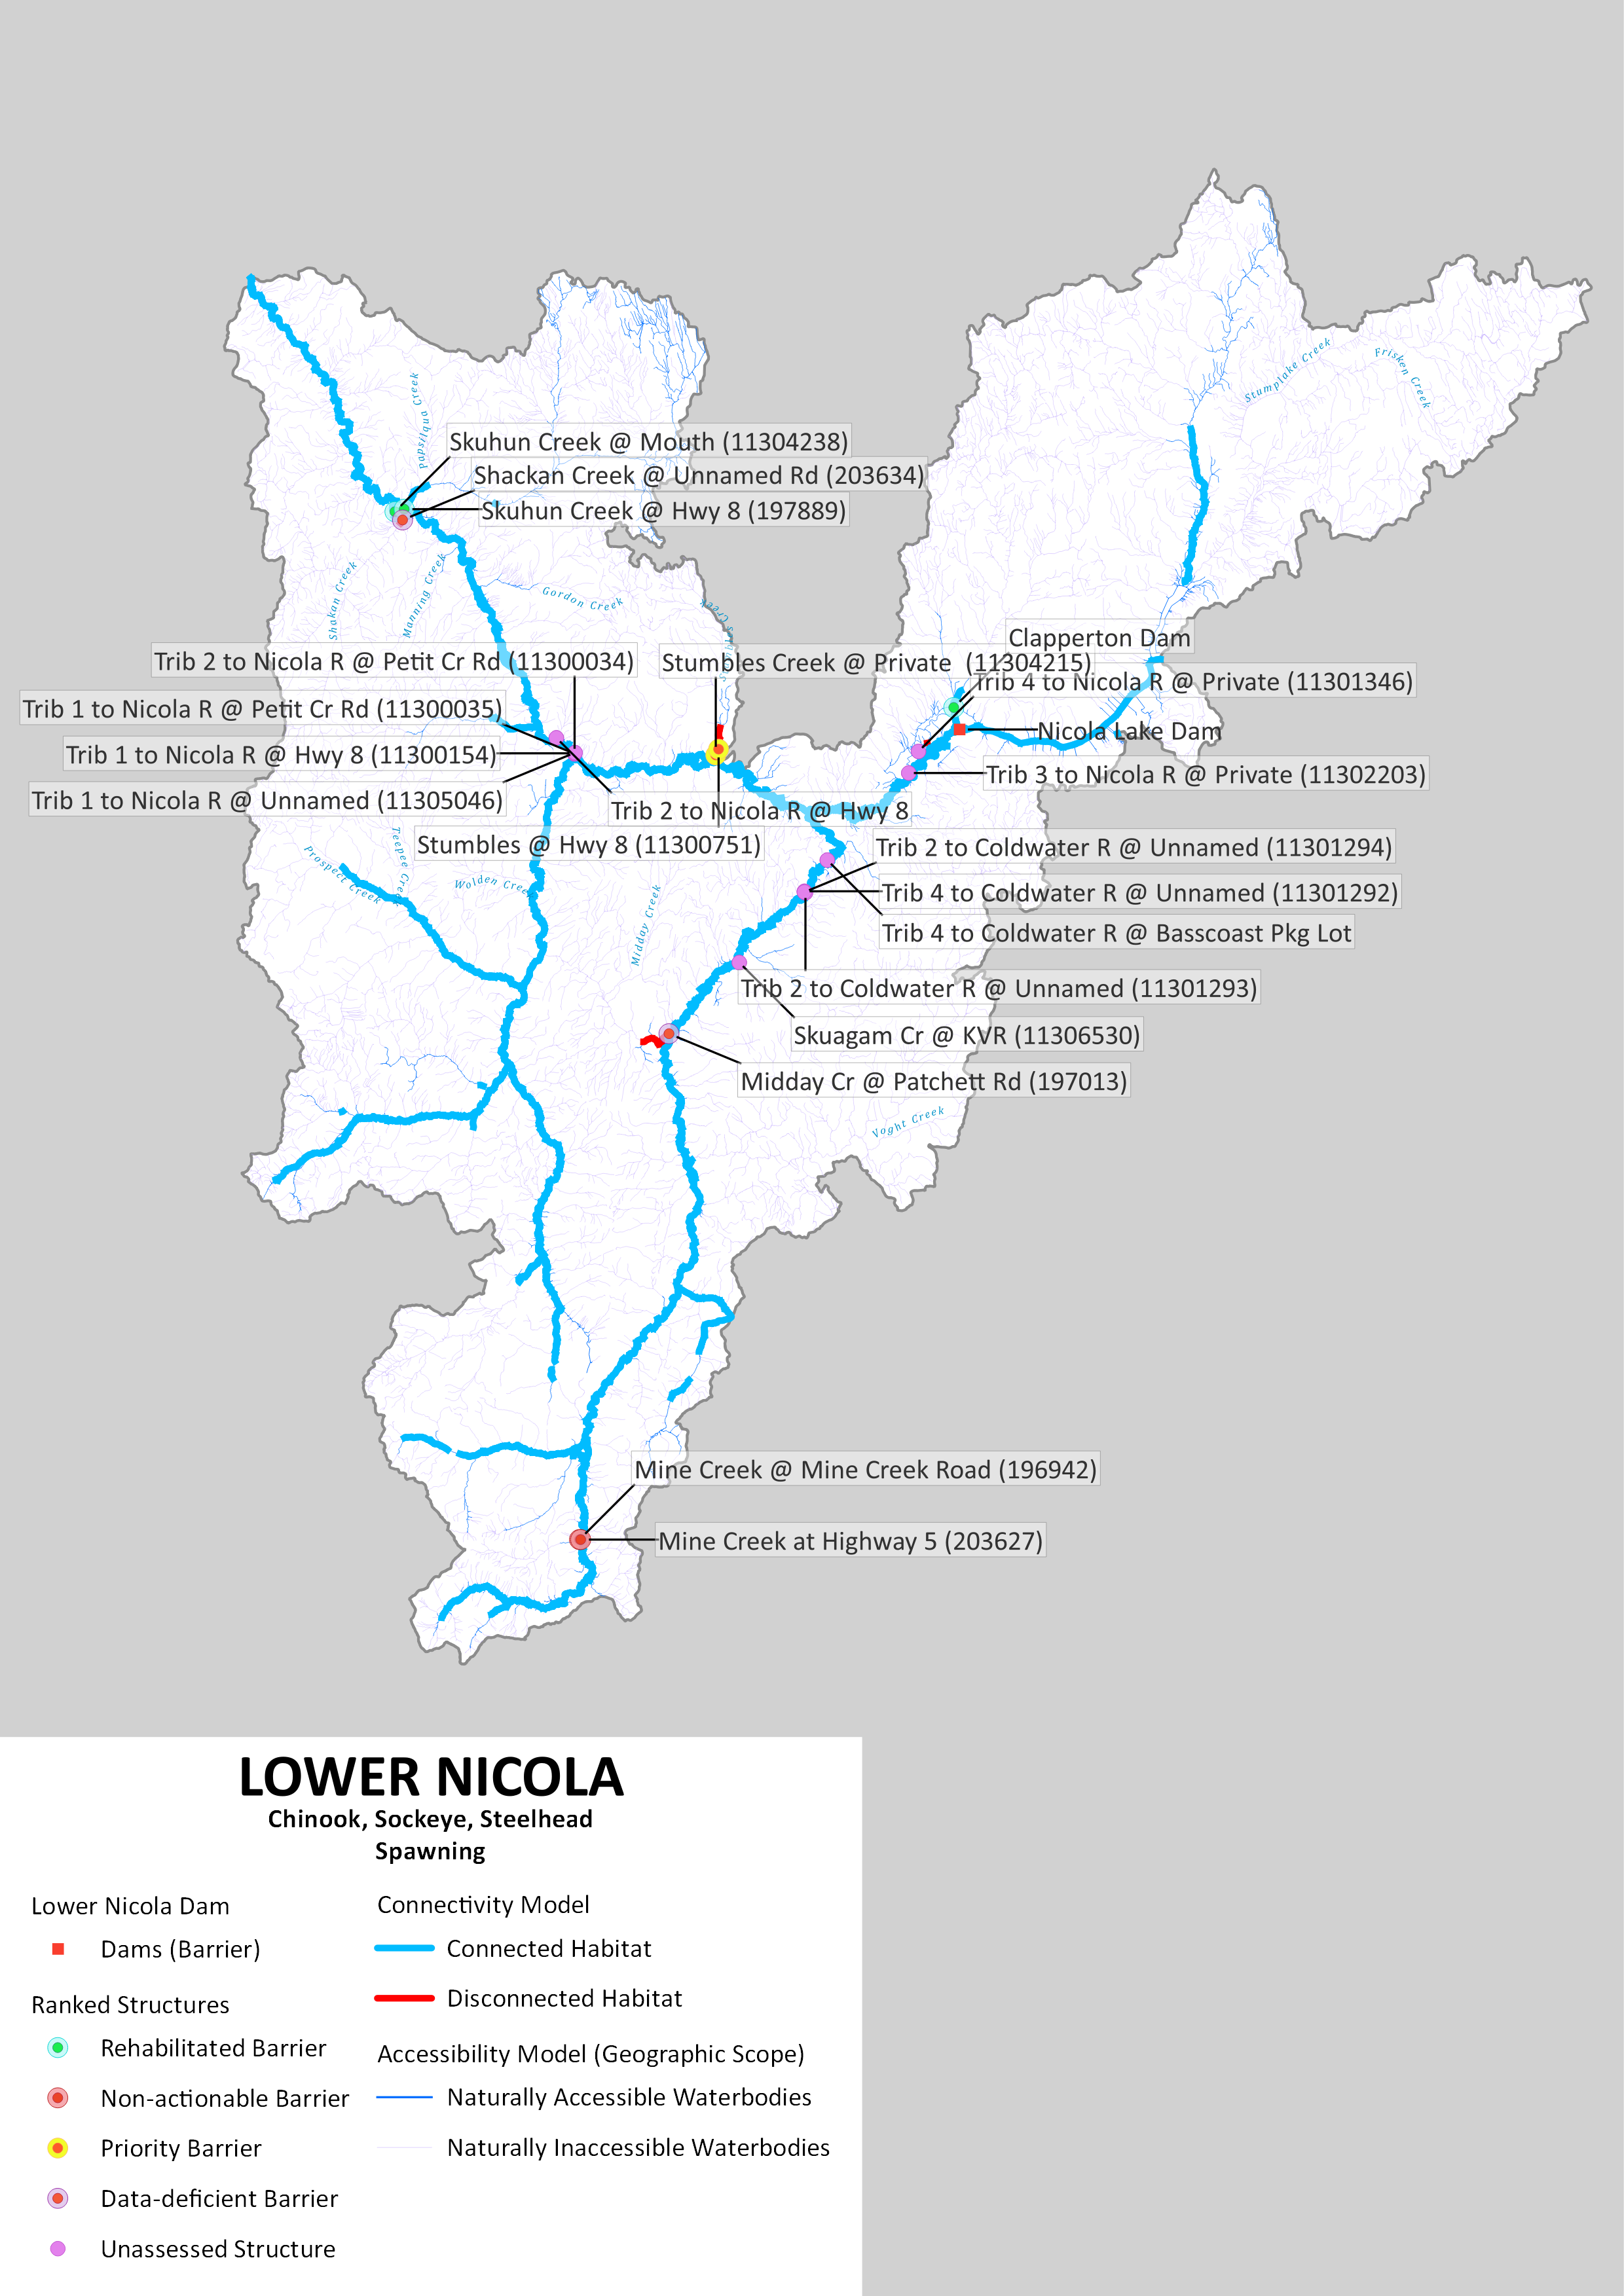
In the Lower Nicola River watershed, 377.18 km of spawning habitat are currently connected to the ocean and 5.47 km are disconnected from it. This means that 98.6% of the 382.64 km of total habitat is connected.
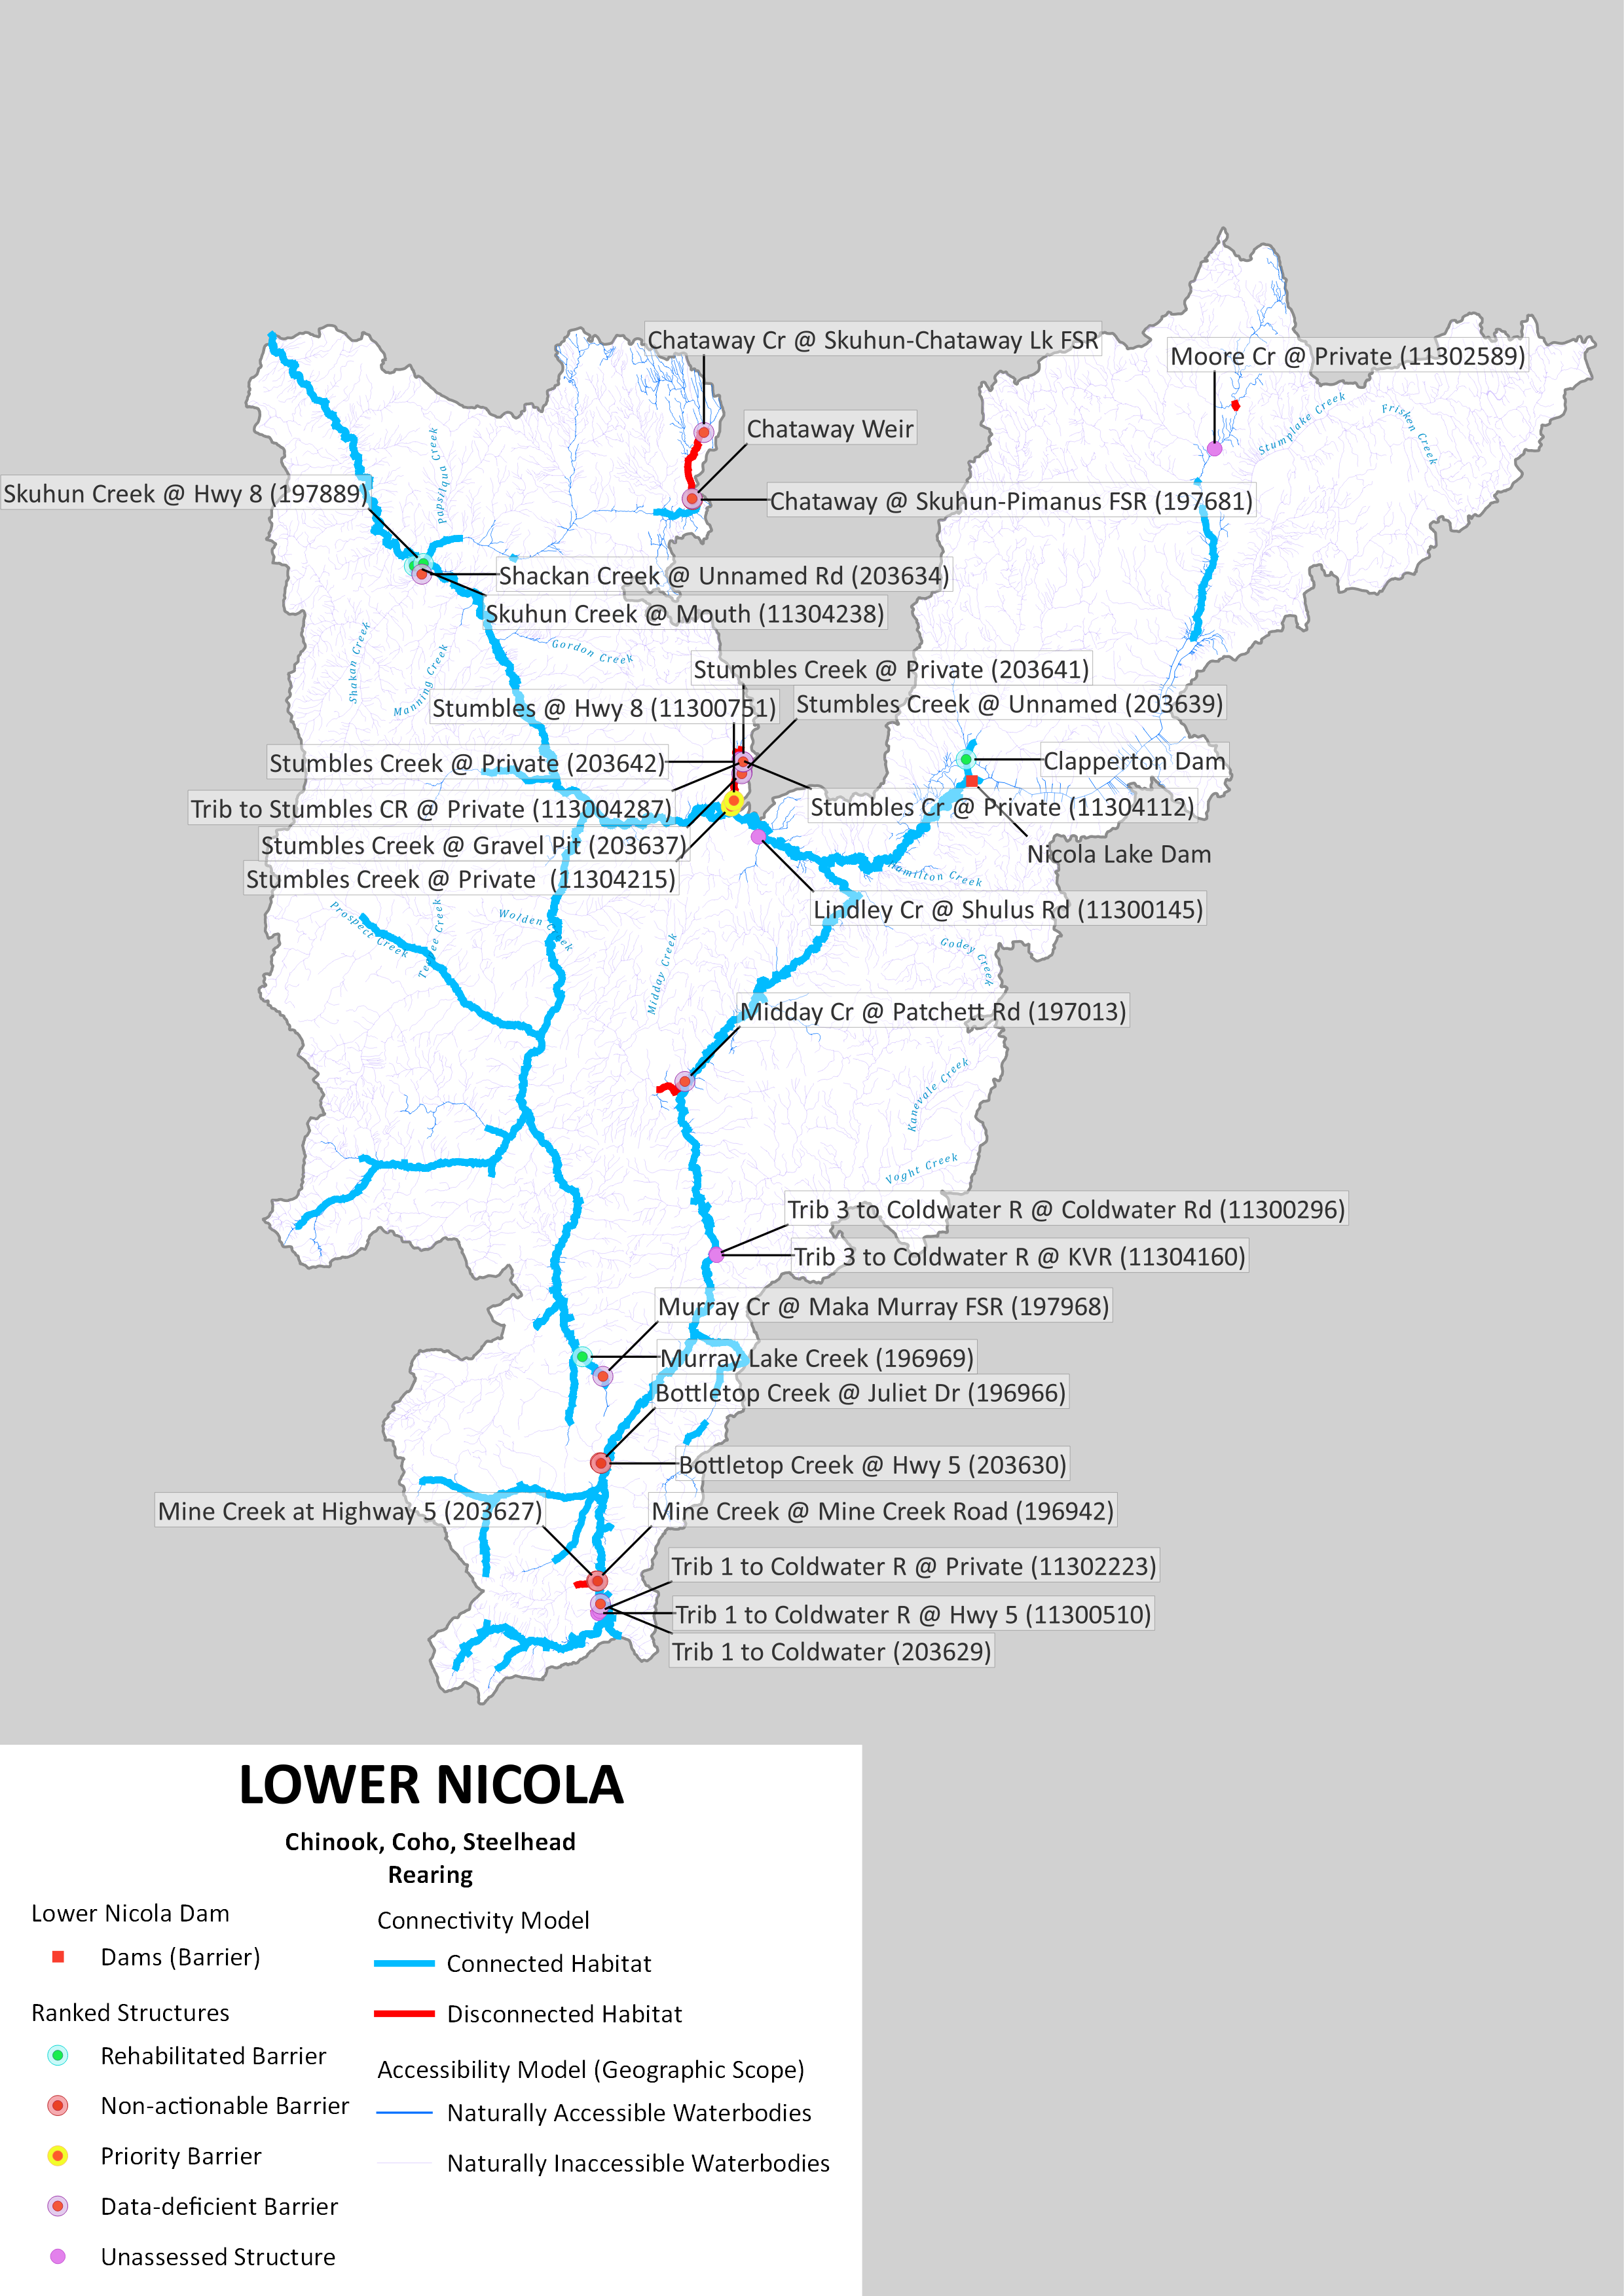
In the Lower Nicola River watershed, 397.28 km of rearing habitat are currently connected to the ocean and 15.05 km are disconnected from it. This means that 96.4% of the 412.33 km of total habitat is connected.
## Goals {-}
```{r tbl6, echo = FALSE, results = 'asis'}
#| label: tbl6
#| tbl-cap: 'Table 6. Goals to improve (1) off-channel thermal refuge, (2) spawning, and (3) rearing habitat connectivity for Pacific salmon and steelhead in the Lower Nicola River watershed over the lifespan of the WCRP (2021-2031). The goals were established through discussions with the Planning Team and represent the resulting desired state of connectivity in the watershed. The goals are subject to change as more information and data are collected over the course of the plan timeline (e.g., the current connectivity status is updated based on barrier field assessments).'
#| warning: false
#| echo: false
source("Rscripts/table_formatting.R")
library("flextable")
data <- read.csv("data/table6.csv", check.names=FALSE)
ft <- flextable(data)
ft <- format_flextable(ft)
ftStructure Count
In the Lower Nicola River watershed, 18 structures potentially disconnect spawning habitat. Of these, 2 are identified as barriers in need of rehabilitation (priority barriers), 2 are identified as barriers that do not warrant rehabilitation (non-actionable), and 14 require further field assessment.
In the Lower Nicola River watershed, 25 structures potentially disconnect rearing habitat. Of these, 2 are identified as barriers in need of rehabilitation (priority barriers), 5 are identified as barriers that do not warrant rehabilitation (non-actionable), and 18 require further field assessment.
Maps
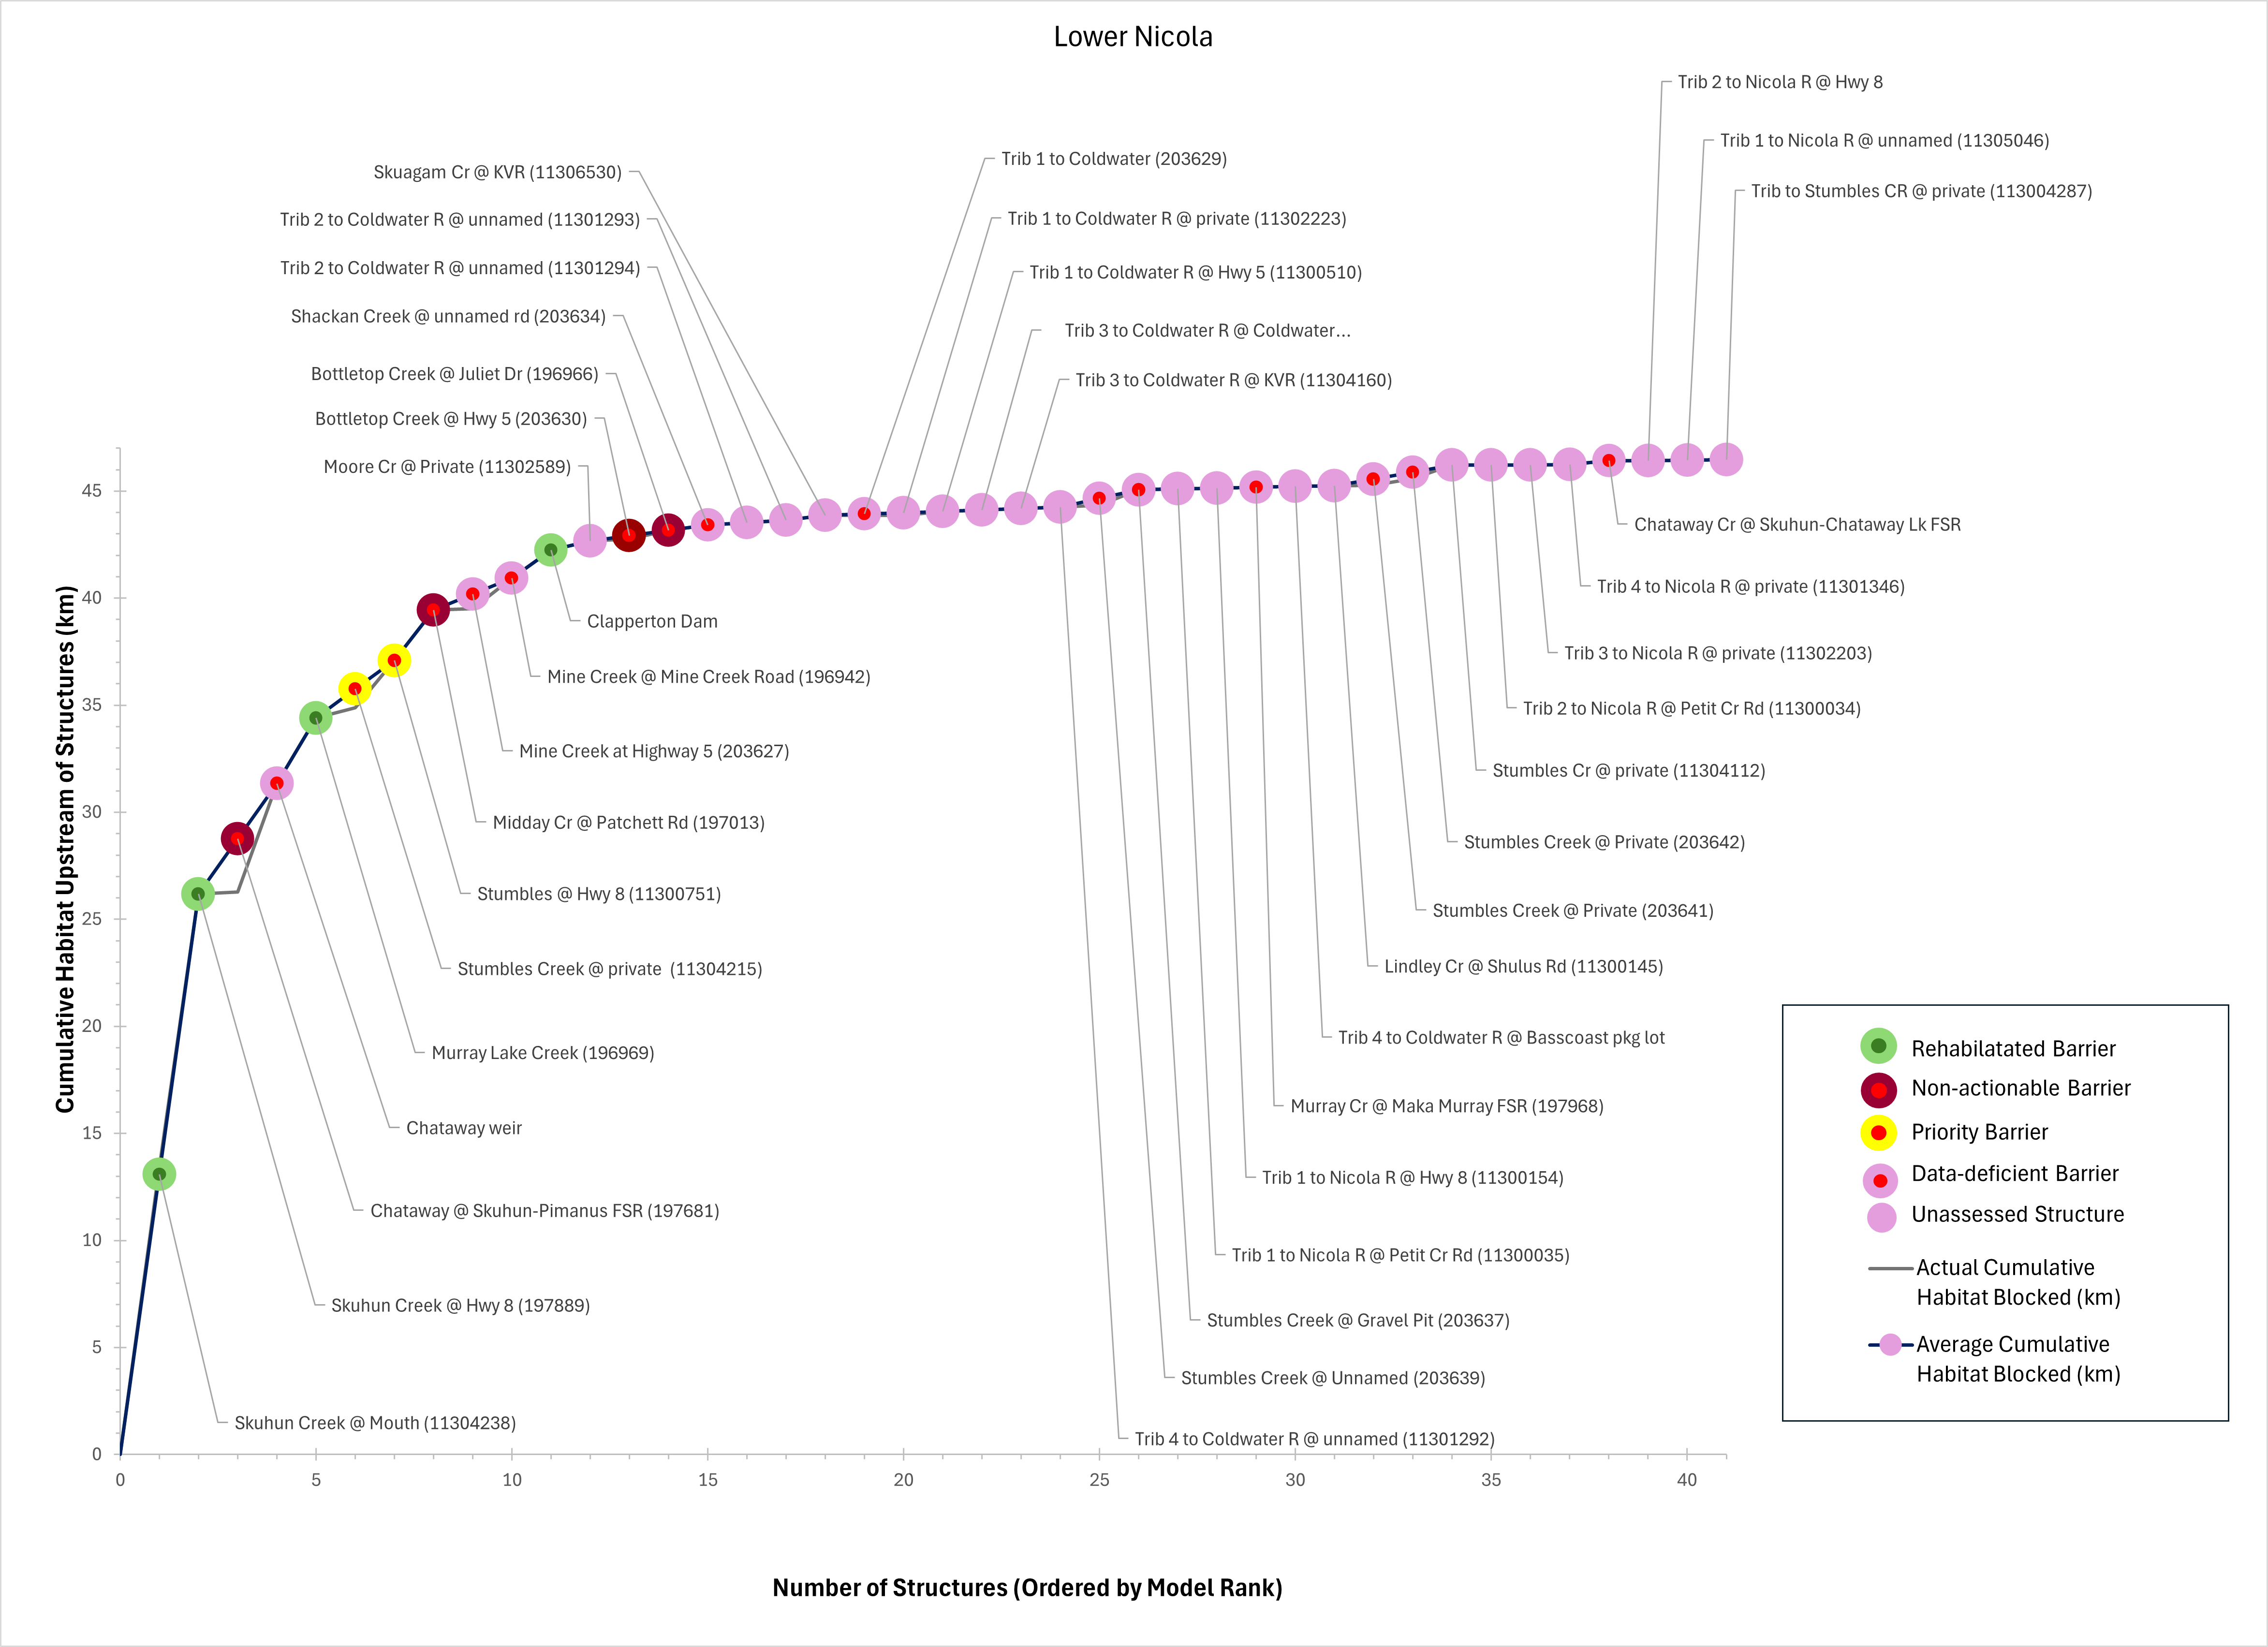
Habitat Accumulation Curves
Habitat Accumulation Summary Table
Table 7: Labelled structures in the Habitat Accumulation Curve (Figure 1), their rank, and upstream spawning and rearing habitat for Pacific Salmon and steelhead in The Lower Nicola River watershed. Habitat gain (averaged across sets) represents the amount (km) of habitat upstream of that structure to the next structure and depicts the potential gain in habitat if passage at that structure was restored.
```{r hac1, echo = FALSE, results = ‘asis’} #| label: table-1 #| tbl-cap: “Table 1. Labelled structures in the Habitat Accumulation Curve (Figure 3), their rank, and weighted upstream habitat for Atlantic Salmon in the Stewiacke watershed. Weighted Habitat Gain per Set represents the amount (km) of weighted habitat upstream of that structure to the next structure and depicts the immediate potential gain in habitat if passage at that structure was restored. Total Weighted Habitat Upstream per Set (km) represents the total amount (km) of weighted habitat upstream of the set, regardless of upstream structures, and depicts the long-term potential gain in habitat if passage at that structure (and all other upstream structures) was restored. Structure rank represents the model ranking of all sets of 1 or more structures.” #| warning: false #| echo: false source(“Rscripts/table_formatting.R”) library(“flextable”)
data <- read.csv(“data/table_hacsum.csv”, check.names=FALSE) ft <- flextable(data) ft <- format_flextable(ft) ft ```